
Living at the First Standard Deviation
Let’s say you spend the weekend in your local park capturing pigeons and measuring their wingspans.

After the police release you from your psychiatric evaluation, you eagerly rush home and look at the numbers. You will, without fail, get data that looks something like this:
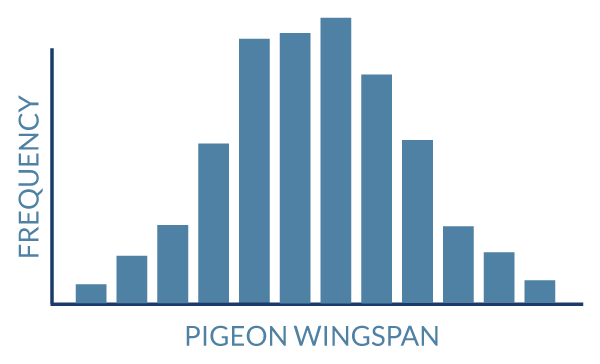
A small number of birds will have quite long wings, a small number will have unusually short wings, and most will fall somewhere in the middle. This would be true of any given species of bird in any given place. It would also be true of almost any measurable feature. Measure the length of toucans’ beaks or the height of cockatoos’ crests and your data will tend to take the same basic shape. As your sample size grows, the bumps smooth out until you arrive at a familiar form.

↓

This is of course, the bell curve, what statisticians call "normal distribution", and when you peel back any natural phenomenon you'll find it waiting for you right there in the data. It doesn't matter if it's annual rainfall, erosion of sand dunes, weight of sea turtles, height of humans, or the outcome of standardized tests, the bell curve accurately describes their probability outcomes. One curve to rule them all!
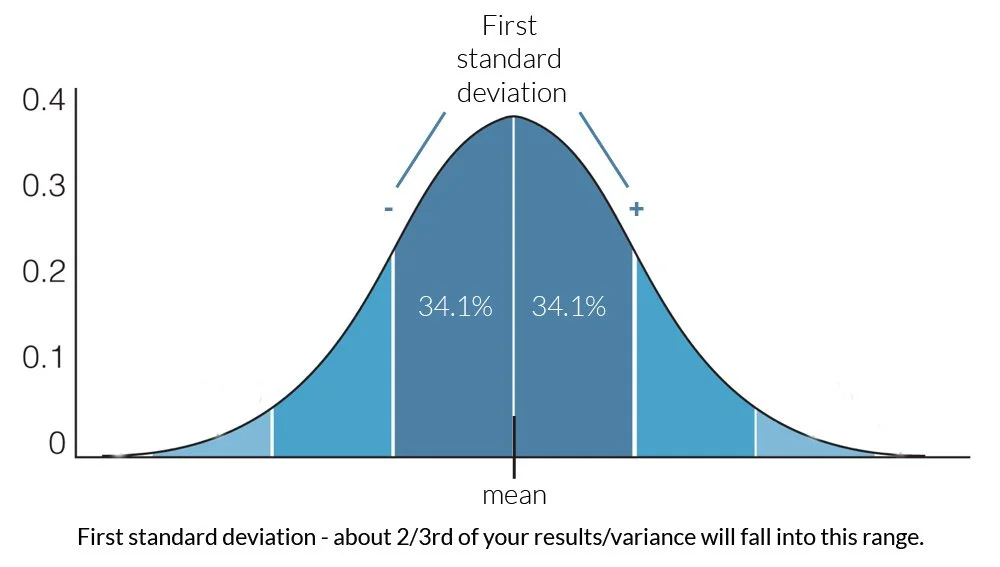
If you want to do interesting things with a bell curve, you need to get into standard deviations. The math here is a bit tricky and not particularly important, but by taking the square of the variance in the bell curve you arrive at a set of discrete dividing lines which help you understand the data. Hang with me through this!
About 68 percent of all values fall within one standard deviation of the mean and median. Roughly 34 percent sit above the center and 34 percent below.
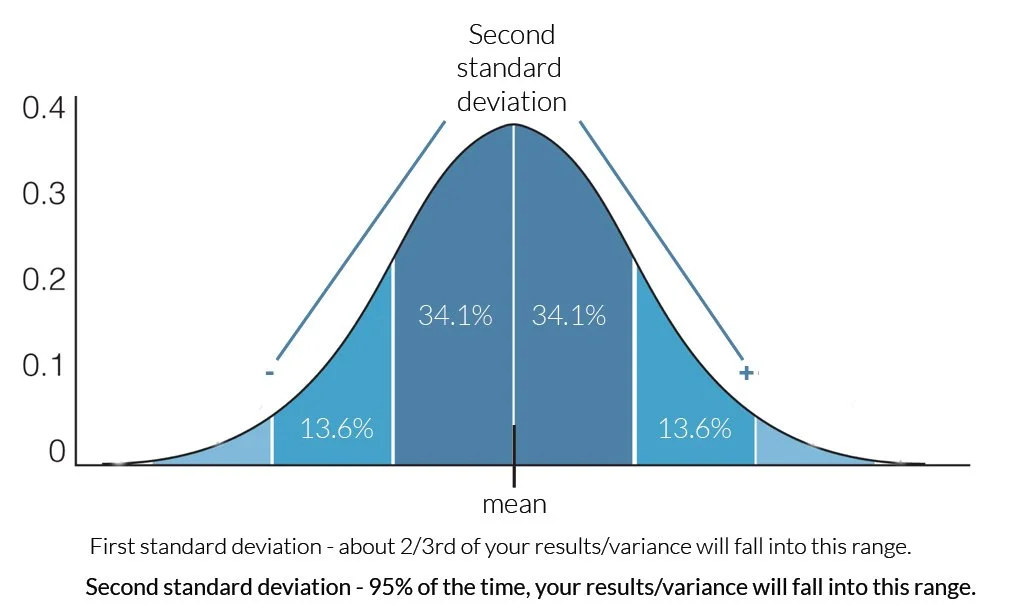
If you go out to the second deviation, you then pick up an additional 13.6% on either side, for a total of about 95% of all the data.
At three standard deviations, you capture roughly 99.7 percent of the data.
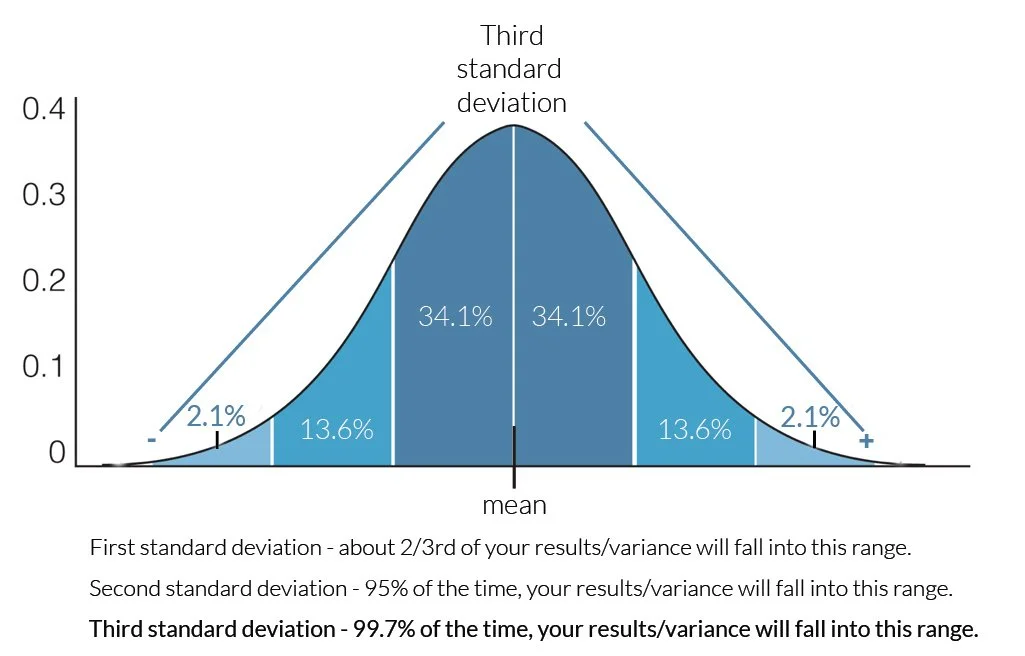
99.7% is a solid statistical number, unless you’re dealing with some very high level science. (When finding the Higgs-Boson, CERN physicists were looking for the 5th deviation as proof. That’s 99.9999%!) For daily life, 99.7% marks the edge of plausibility.
With this in mind, you could go back to the park, measure a random pigeon’s wingspan, and see whether it falls near the center of the distribution or far from it. If you measure a pigeon more than three standard deviations from the mean and median, you should probably recheck your measurement, or check whether it’s actually a pigeon.
This framework applies to us as well. Many people make themselves unhappy because they forget that most experiences in life cluster near the middle of a probability curve.
Here’s an example from my own life.
I used to commute by train from western Tokyo into Shinjuku. There was a transfer point where, if everything went perfectly, I could sprint off the first train, down an escalator, and catch the second train just as its doors were closing.

One morning I was running late. I left my apartment at 7:40. I hit every green light on my bike ride to the station. I immediately found an open bike parking slot. I boarded the first train at the last possible second and somehow made the miracle transfer. Despite leaving late, I arrived in Shinjuku twenty minutes early. I had time to grab a coffee and take a relaxed walk into the office.
What happened next was predictable. My internal sense of a safe departure time shifted to 7:40. After all, it had worked once, right?!
It never worked again.
That miraculous commute required dozens of small variables to line up perfectly. The miracle didn’t repeat itself, but I was still trying to leave at 7:40. I began arriving late several times a week, stressing myself out and raising eyebrows with the manager.
What I had experienced that perfect morning was a once-a-year occurrence. If something happens 1 day in 365, it has a .27% chance of happening on any given day of that year. This is almost exactly where the third standard deviation falls.
I was comparing each day not to the mean, but to an event way out on the edge of the bell curve. This blew up in my face as my commute reverted to the mean, and became disastrous on mornings when my commute time fell on the other side of the curve, as probability says it must. (This would be things like train delays, forgetting my wallet, and one morning, a horrendous urban dust storm.)
The brain gives disproportionate weight to rare events. Statistically unlikely days lodge themselves in memory. Years later, I can’t recall almost any of my Tokyo commutes, but I clearly remember that one impossibly fast morning, as well as that one wild dust storm.
If you examine your own thinking, you’ll probably find that you’re unconsciously comparing everyday experiences to moments that existed far out on the edge of your personal bell curve.
You might feel fine today, but not as good as that one afternoon watching the sun set over the hills of Tuscany on your honeymoon.

You might have a solid workout, but it doesn’t compare to the one day when everything clicked and you felt invincible.
You might be eating well this month, but not as perfectly as during that first hyper-disciplined training phase when you tracked every gram and never cheated.
What gets forgotten are all the random variables that made those peak experiences possible. A great workout depends on sleep, nutrition, stress, hormones, mood, and even the music you happened to be listening to. Reproducing all of that consistently is unrealistic, yet we still judge ourselves harshly when we fall short of a statistical anomaly.
Spending too much mental energy comparing present reality to experiences beyond the third standard deviation sets you up for stress and dissatisfaction. When you measure your life against your most extreme outliers, the present will always feel lacking.
In fitness, this mistake shows up constantly. People compare themselves to past versions that no longer represent their current median. Former athletes attempt workouts that would have been challenging even at their peak and end up injured. People eat well for weeks, step on the scale, and expect to see the number they weighed decades ago. Even genuine progress feels like failure when the comparison point is an outlier.

Bodies change. Environments change. That mythically low weight or perfect training cycle was the result of many factors that no longer exist. Sometimes it was something flukey like a faulty scale. Outliers are terrible benchmarks!
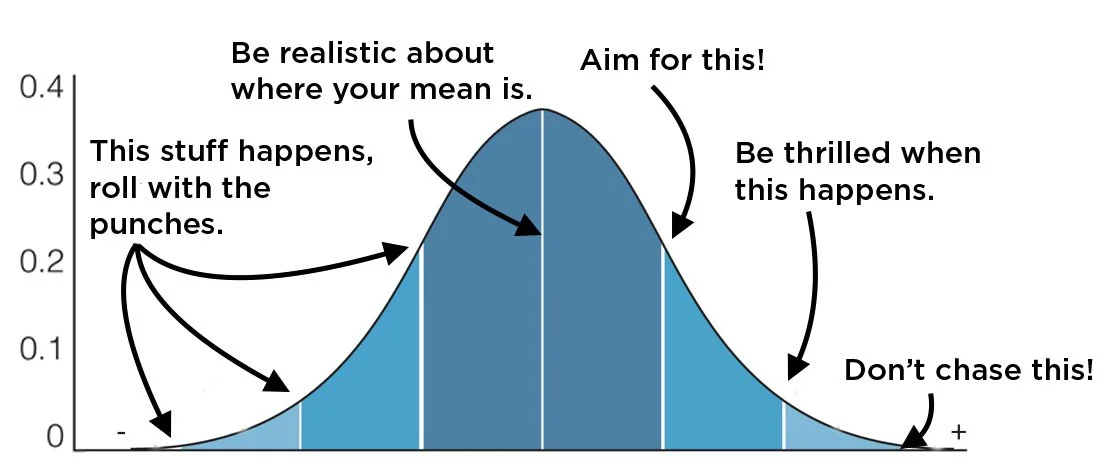
A better approach is to treat third standard deviation experiences for what they are—rare. Enjoy them when they happen, but don’t chase them.
Real progress lives much closer to the center of the curve.
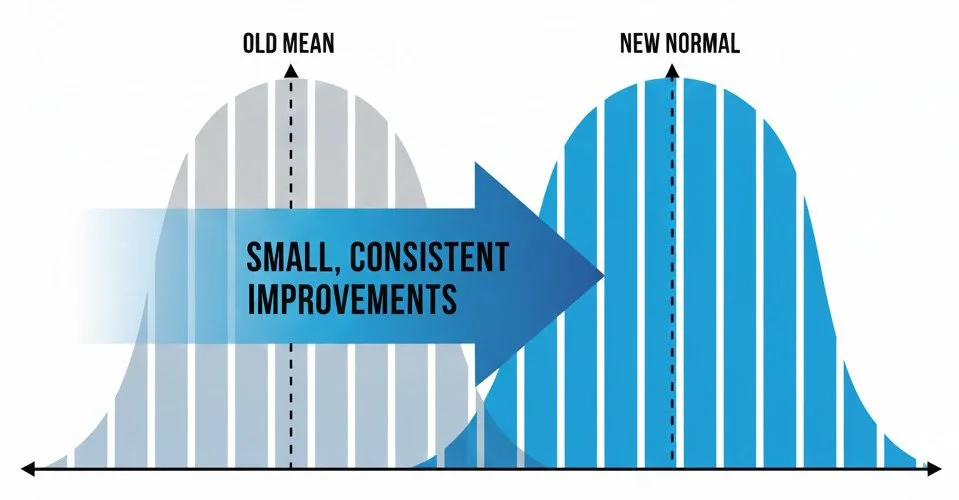
You don’t need a flawless workout every day. You don’t need perfect nutrition. Aim to be modestly better than your current average and middle ground. Think of it as nudging your first standard deviation to the right, not recreating lightning in a bottle.
Some days will be better than that. Some will be worse. Over time, consistent small improvements pull the entire curve in the positive direction. What was once slightly above average becomes your new normal.
From there, you repeat the process.
When your efforts land on the low side of the curve, don’t spiral. Bad days are statistically guaranteed. Take them as part of the distribution and keep going. The curve will swing back.
To sum it up:
Cherish rare peak experiences when they appear, but don’t center your life around them. They’re unicorns, appearing when you least expect them. Treat them as such.
Real change happens slowly, without fanfare, at the first standard deviation. Make it your home base for daily effort and watch the results roll in!